Examples
Loading and plotting
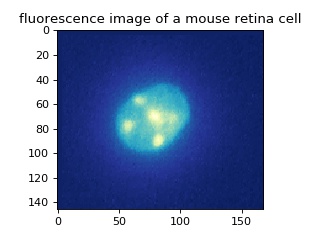
This example illustrates the simple usage of the
flimage.FLImage class for reading and
managing quantitative phase data. The attribute FLImage.fluorescence
yields the image data.
The image shows a young retina cell. The original dataset, available on
figshare
(retina-young_sinogram_fli.h5) [SCG+17], can be opened in
the same manner using the
flimage.FLSeries class.
 1import matplotlib.pylab as plt
 2import flimage
 3
 4# load the experimental data
 5fli = flimage.FLImage(h5file="./data/retina_p10.h5", h5mode="r")
 6
 7# plot
 8plt.figure(figsize=(4, 3))
 9
10plt.subplot(title="fluorescence image of a mouse retina cell")
11plt.imshow(fli.fl, cmap="YlGnBu_r")
12
13plt.tight_layout()
14plt.show()